Free TradingView Indicators by HexaTrades

Explore HexaTrades' collection of powerful TradingView indicators, available completely free. Add your favorites and apply them to any chart instantly with just one click.

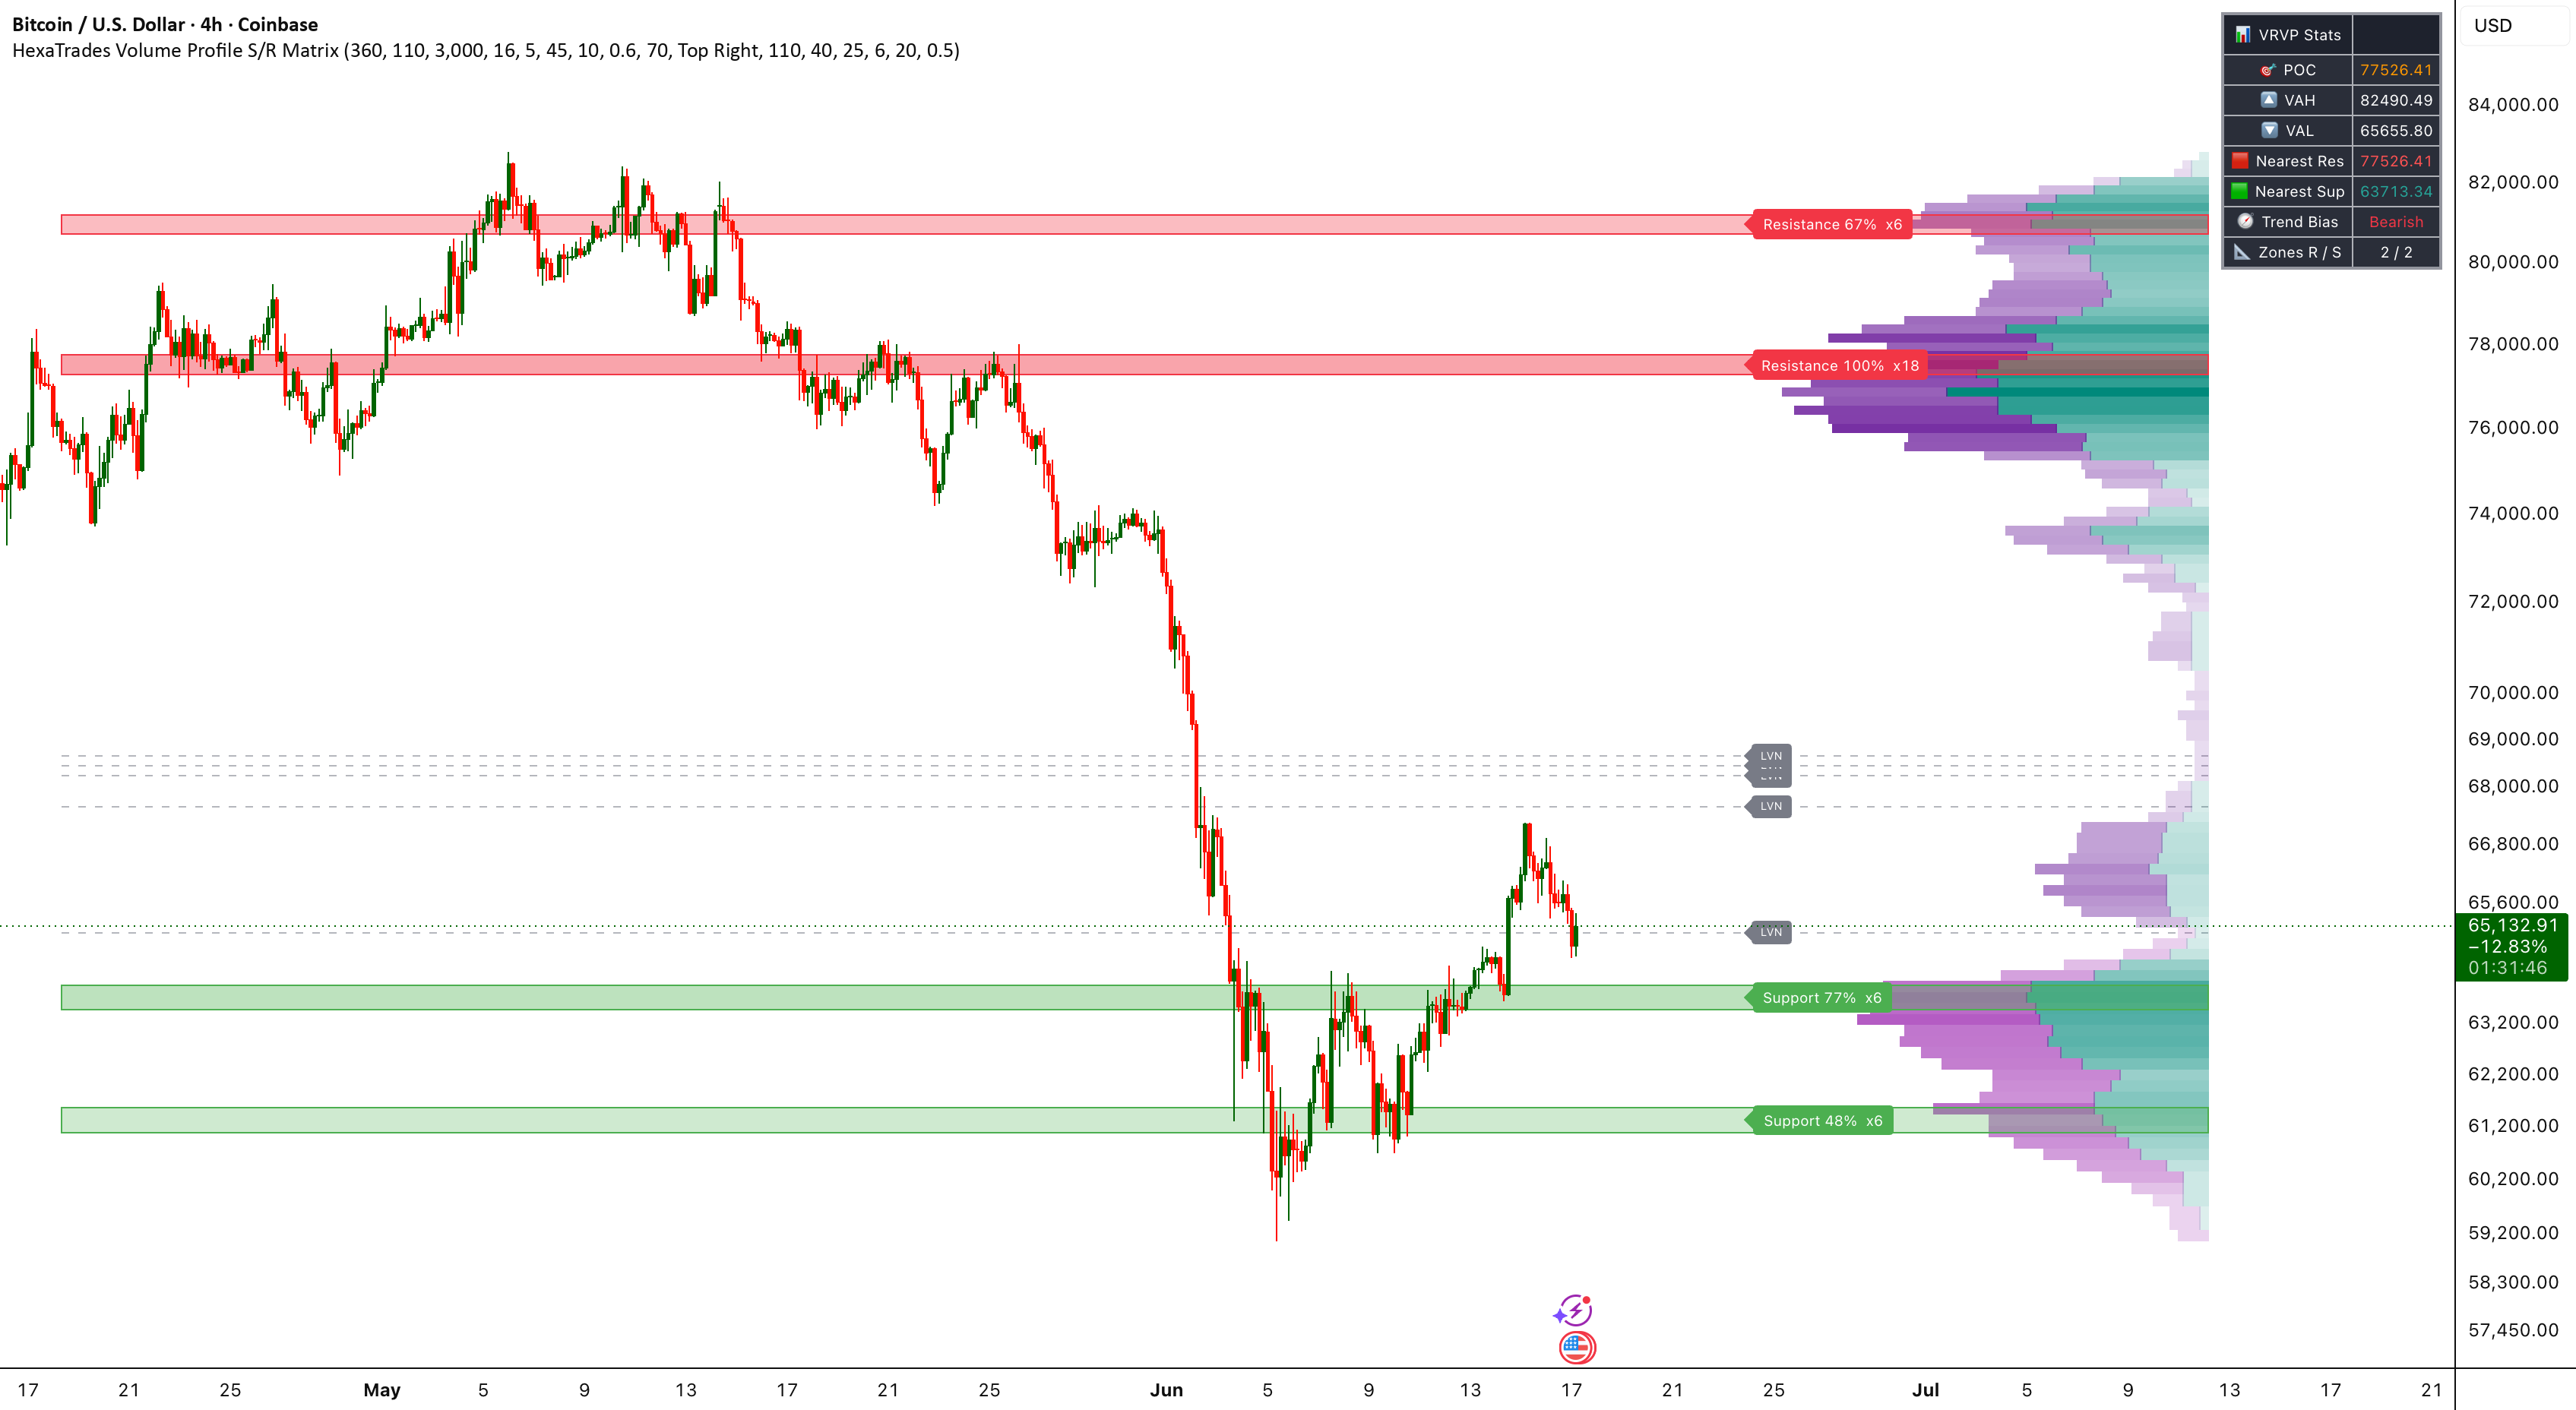
Volume Profile Support & Resistance Matrix indicator on a TradingView chartLive on TradingView

Volume Profile Support & Resistance Matrix[HexaTrades]

Volume-by-price turned into actionable levels

Reads volume-by-price data to automatically map the support and resistance zones that actually matter, ranking each level by traded volume and retest count so you trade where order flow concentrates.

  • Buy/sell volume histogram showing order-flow balance at every price
  • Auto-detected S/R zones ranked by volume strength
  • Point of Control and Value Area (VAH/VAL) fair-value markers
  • Low-Volume Node detection plus breakout, rejection and touch alerts
View on TradingView
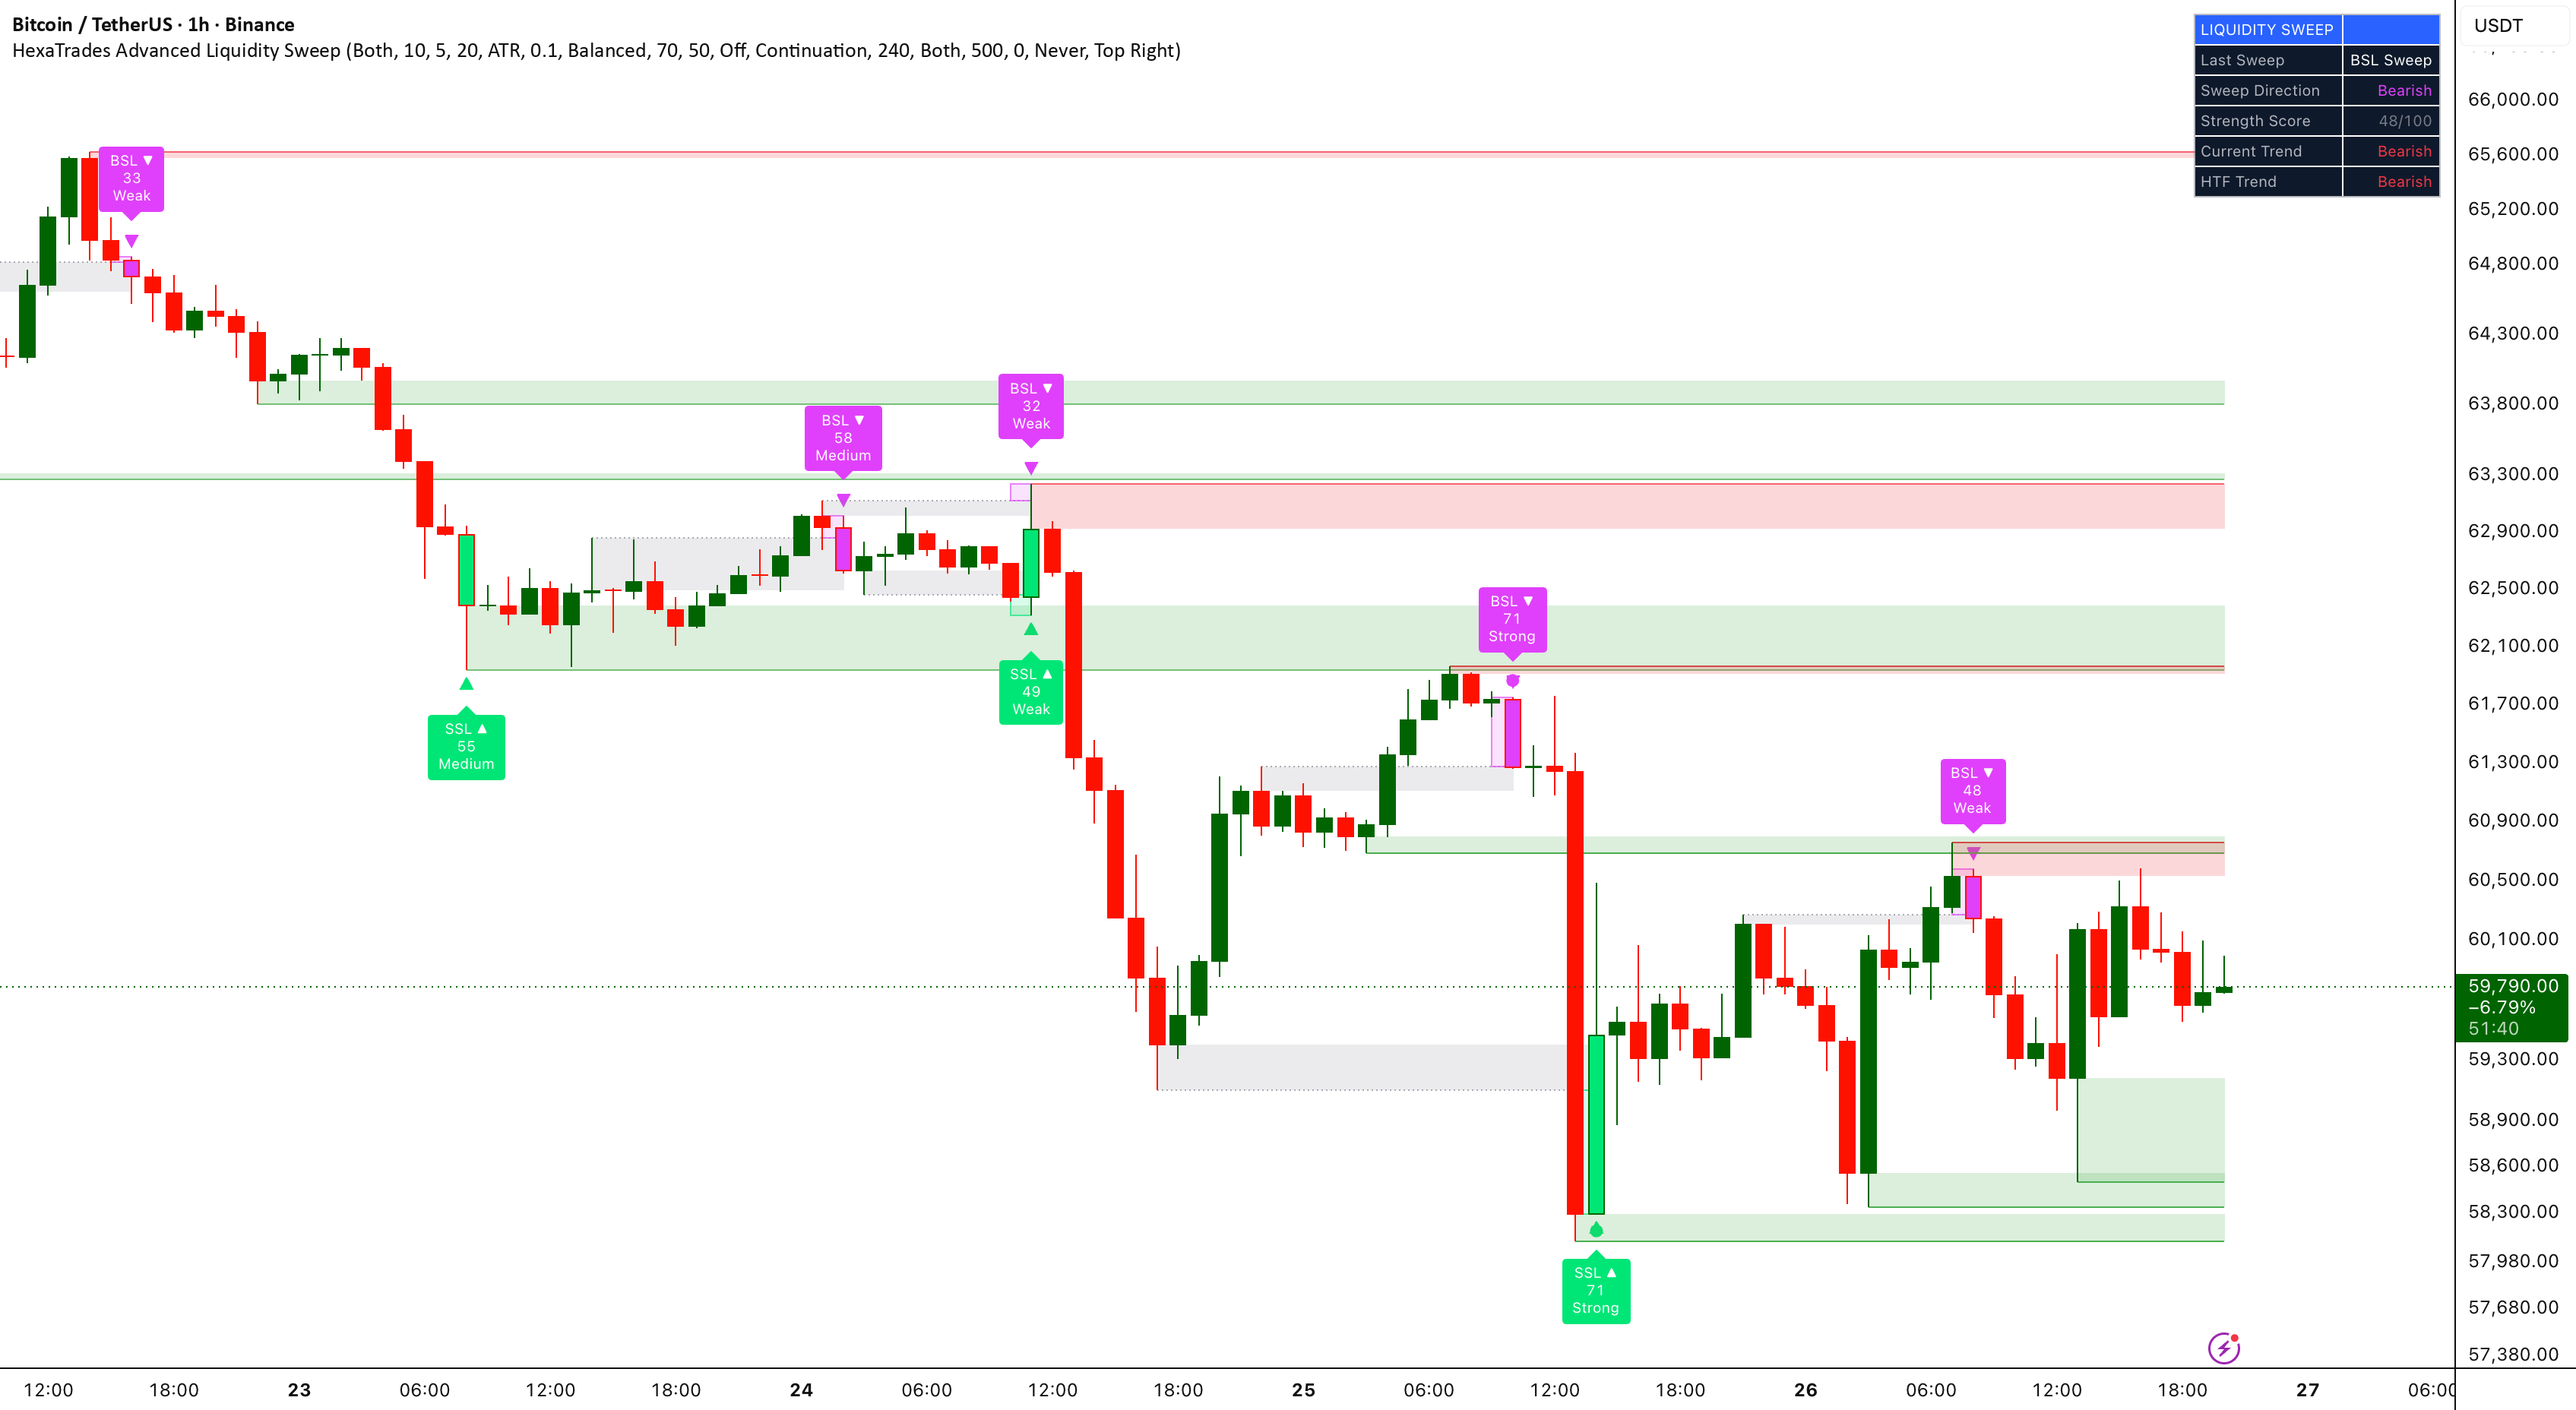
Advanced Liquidity Sweep indicator on a TradingView chartLive on TradingView

Advanced Liquidity Sweep[HexaTrades]

Stop hunts, scored and filtered

A Smart Money Concepts tool that maps buy-side and sell-side liquidity pools, then detects when they get swept — scoring every sweep 0–100 across six confirmation factors so you can tell a minor stop hunt from a genuine reversal-grade liquidity event.

  • Major & minor swing detection with BSL/SSL liquidity lines
  • Equal-highs/lows clustering to spot the biggest liquidity pools
  • 0–100 sweep strength score with STRONG tagging on closed candles only
  • Auto-drawn supply/demand sweep zones plus trend and higher-timeframe filters
View on TradingView
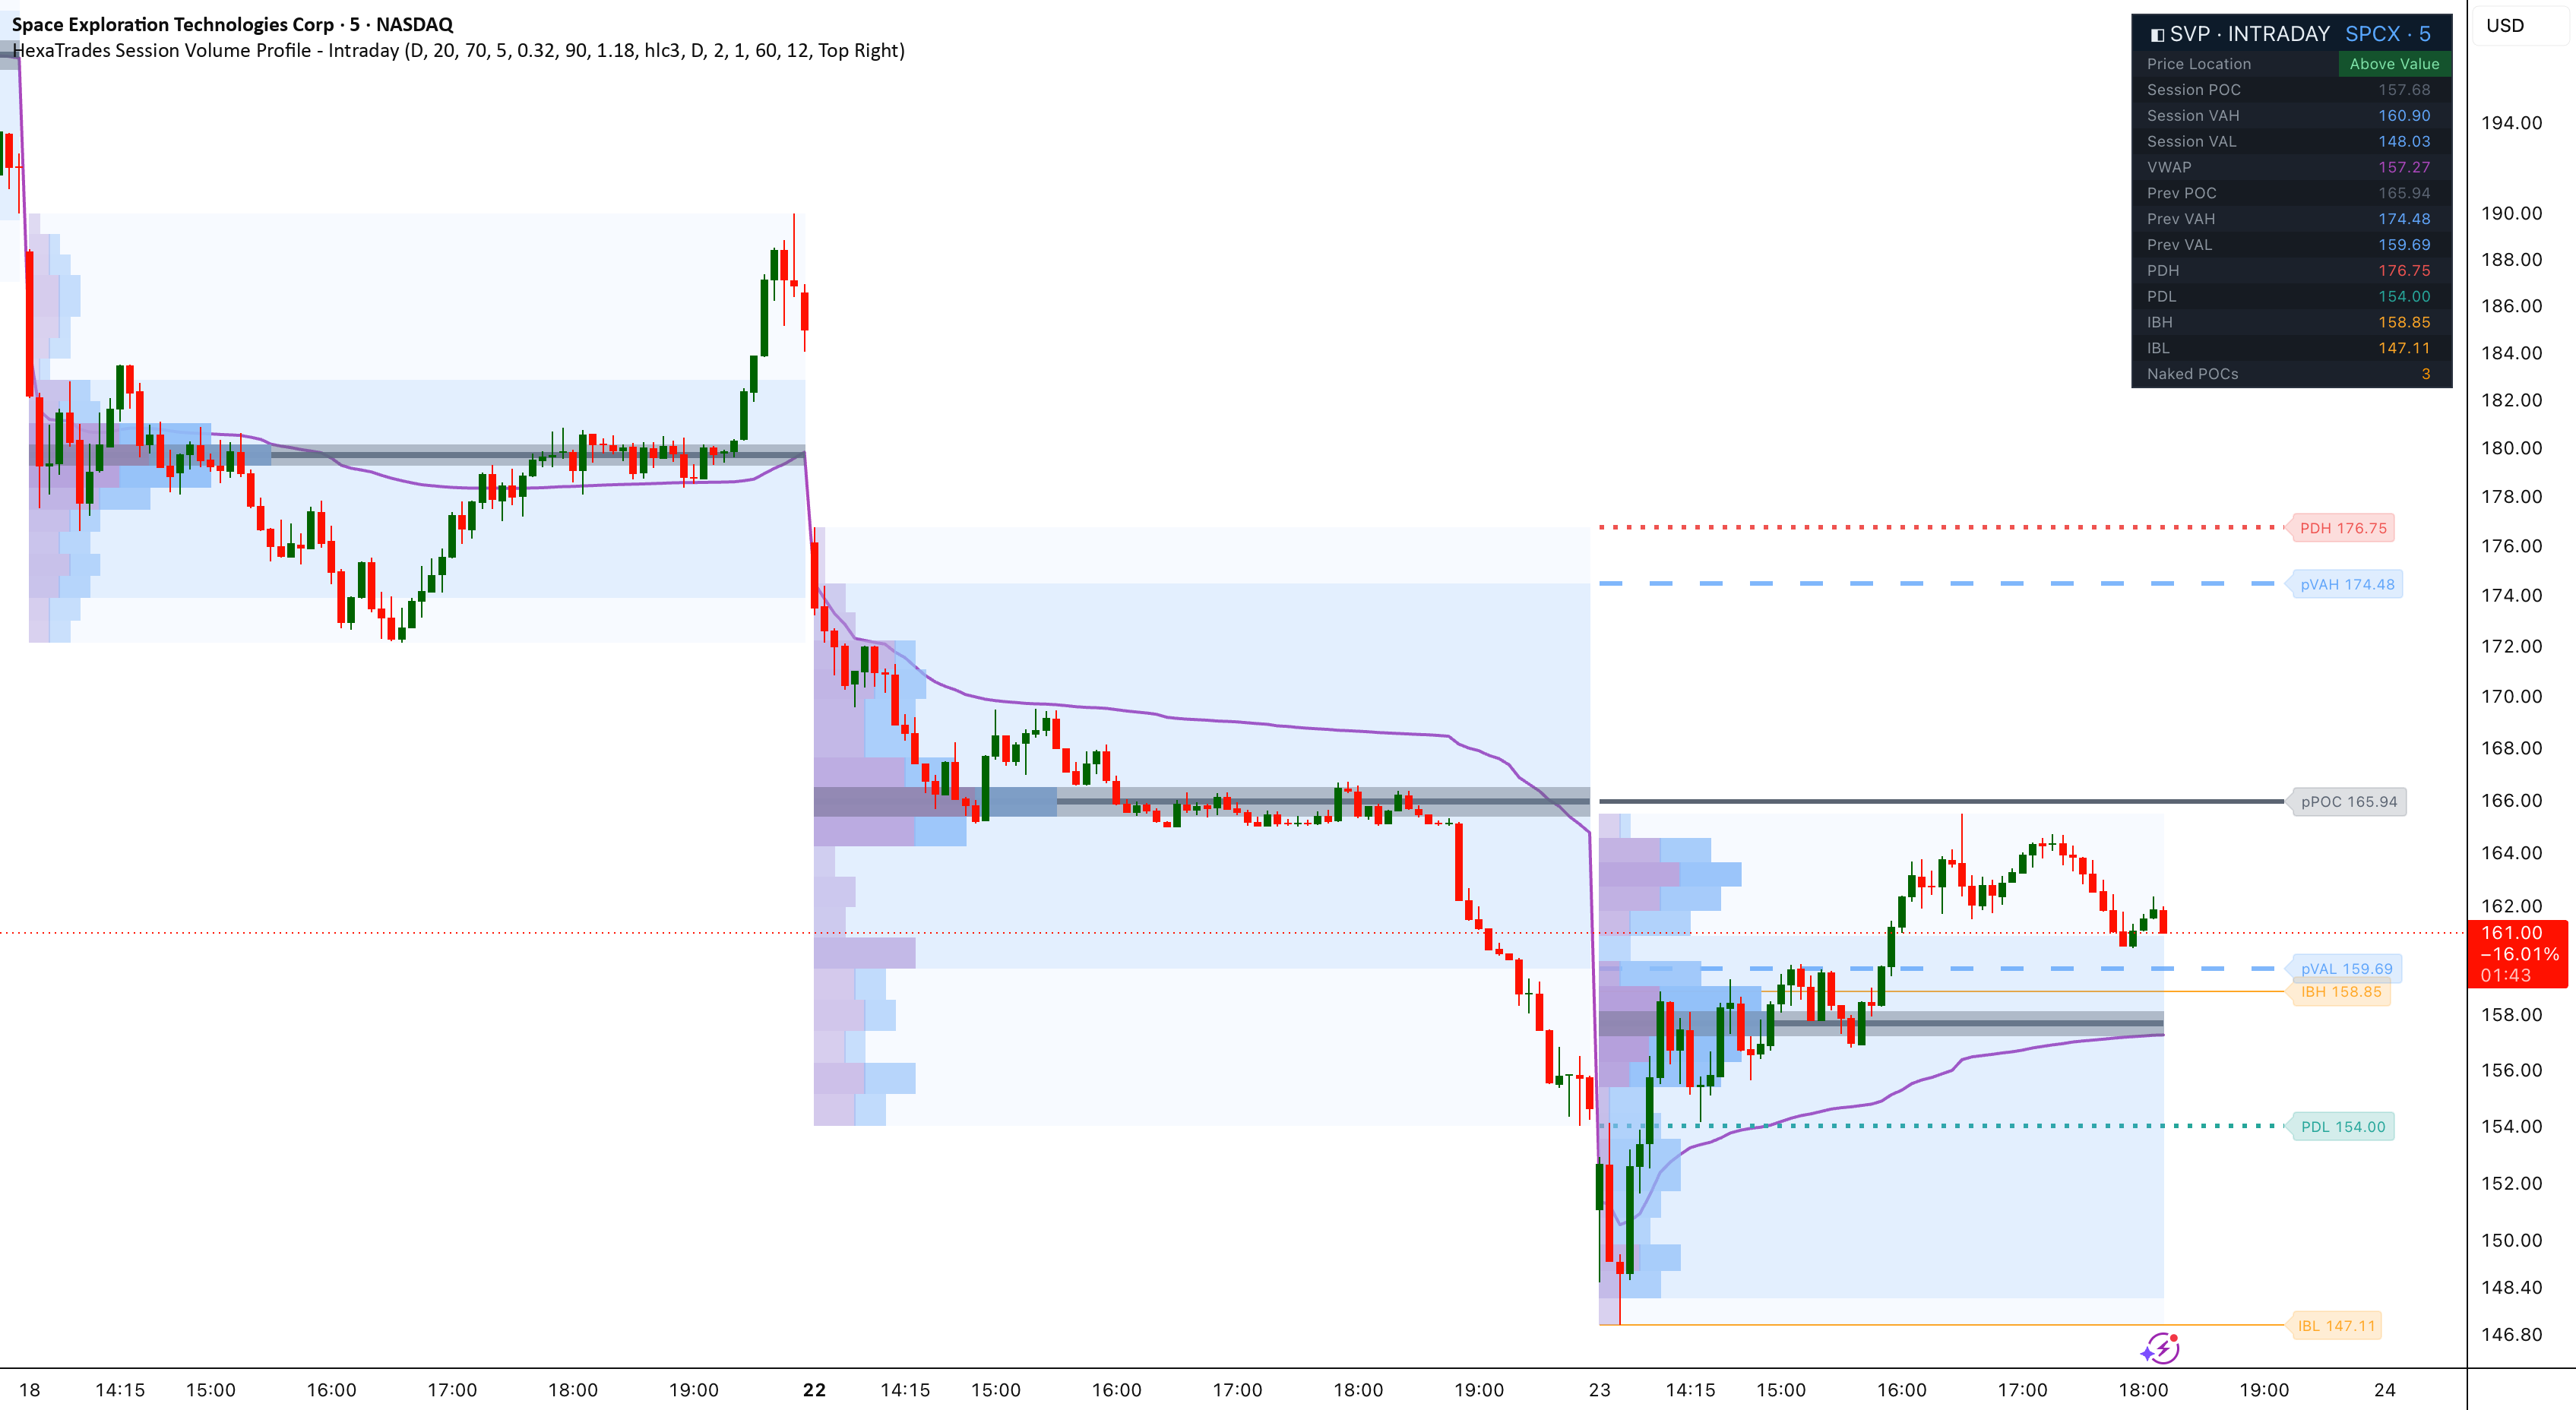
Session Volume Profile - Intraday indicator on a TradingView chartLive on TradingView

Session Volume Profile - Intraday[HexaTrades]

Every session's auction map, drawn for you

Builds a separate volume profile for each trading session and automatically marks the auction levels intraday traders care about — POC, Value Area, VWAP, Initial Balance, previous-day levels and naked POCs — so you always know where the market is accepting price.

  • Per-session volume profile with buy/sell volume tagging
  • Point of Control, VAH/VAL and configurable Value Area percentage
  • VWAP, Initial Balance, previous session and previous day high/low levels
  • Naked POC tracking for untested magnets from earlier sessions
View on TradingView
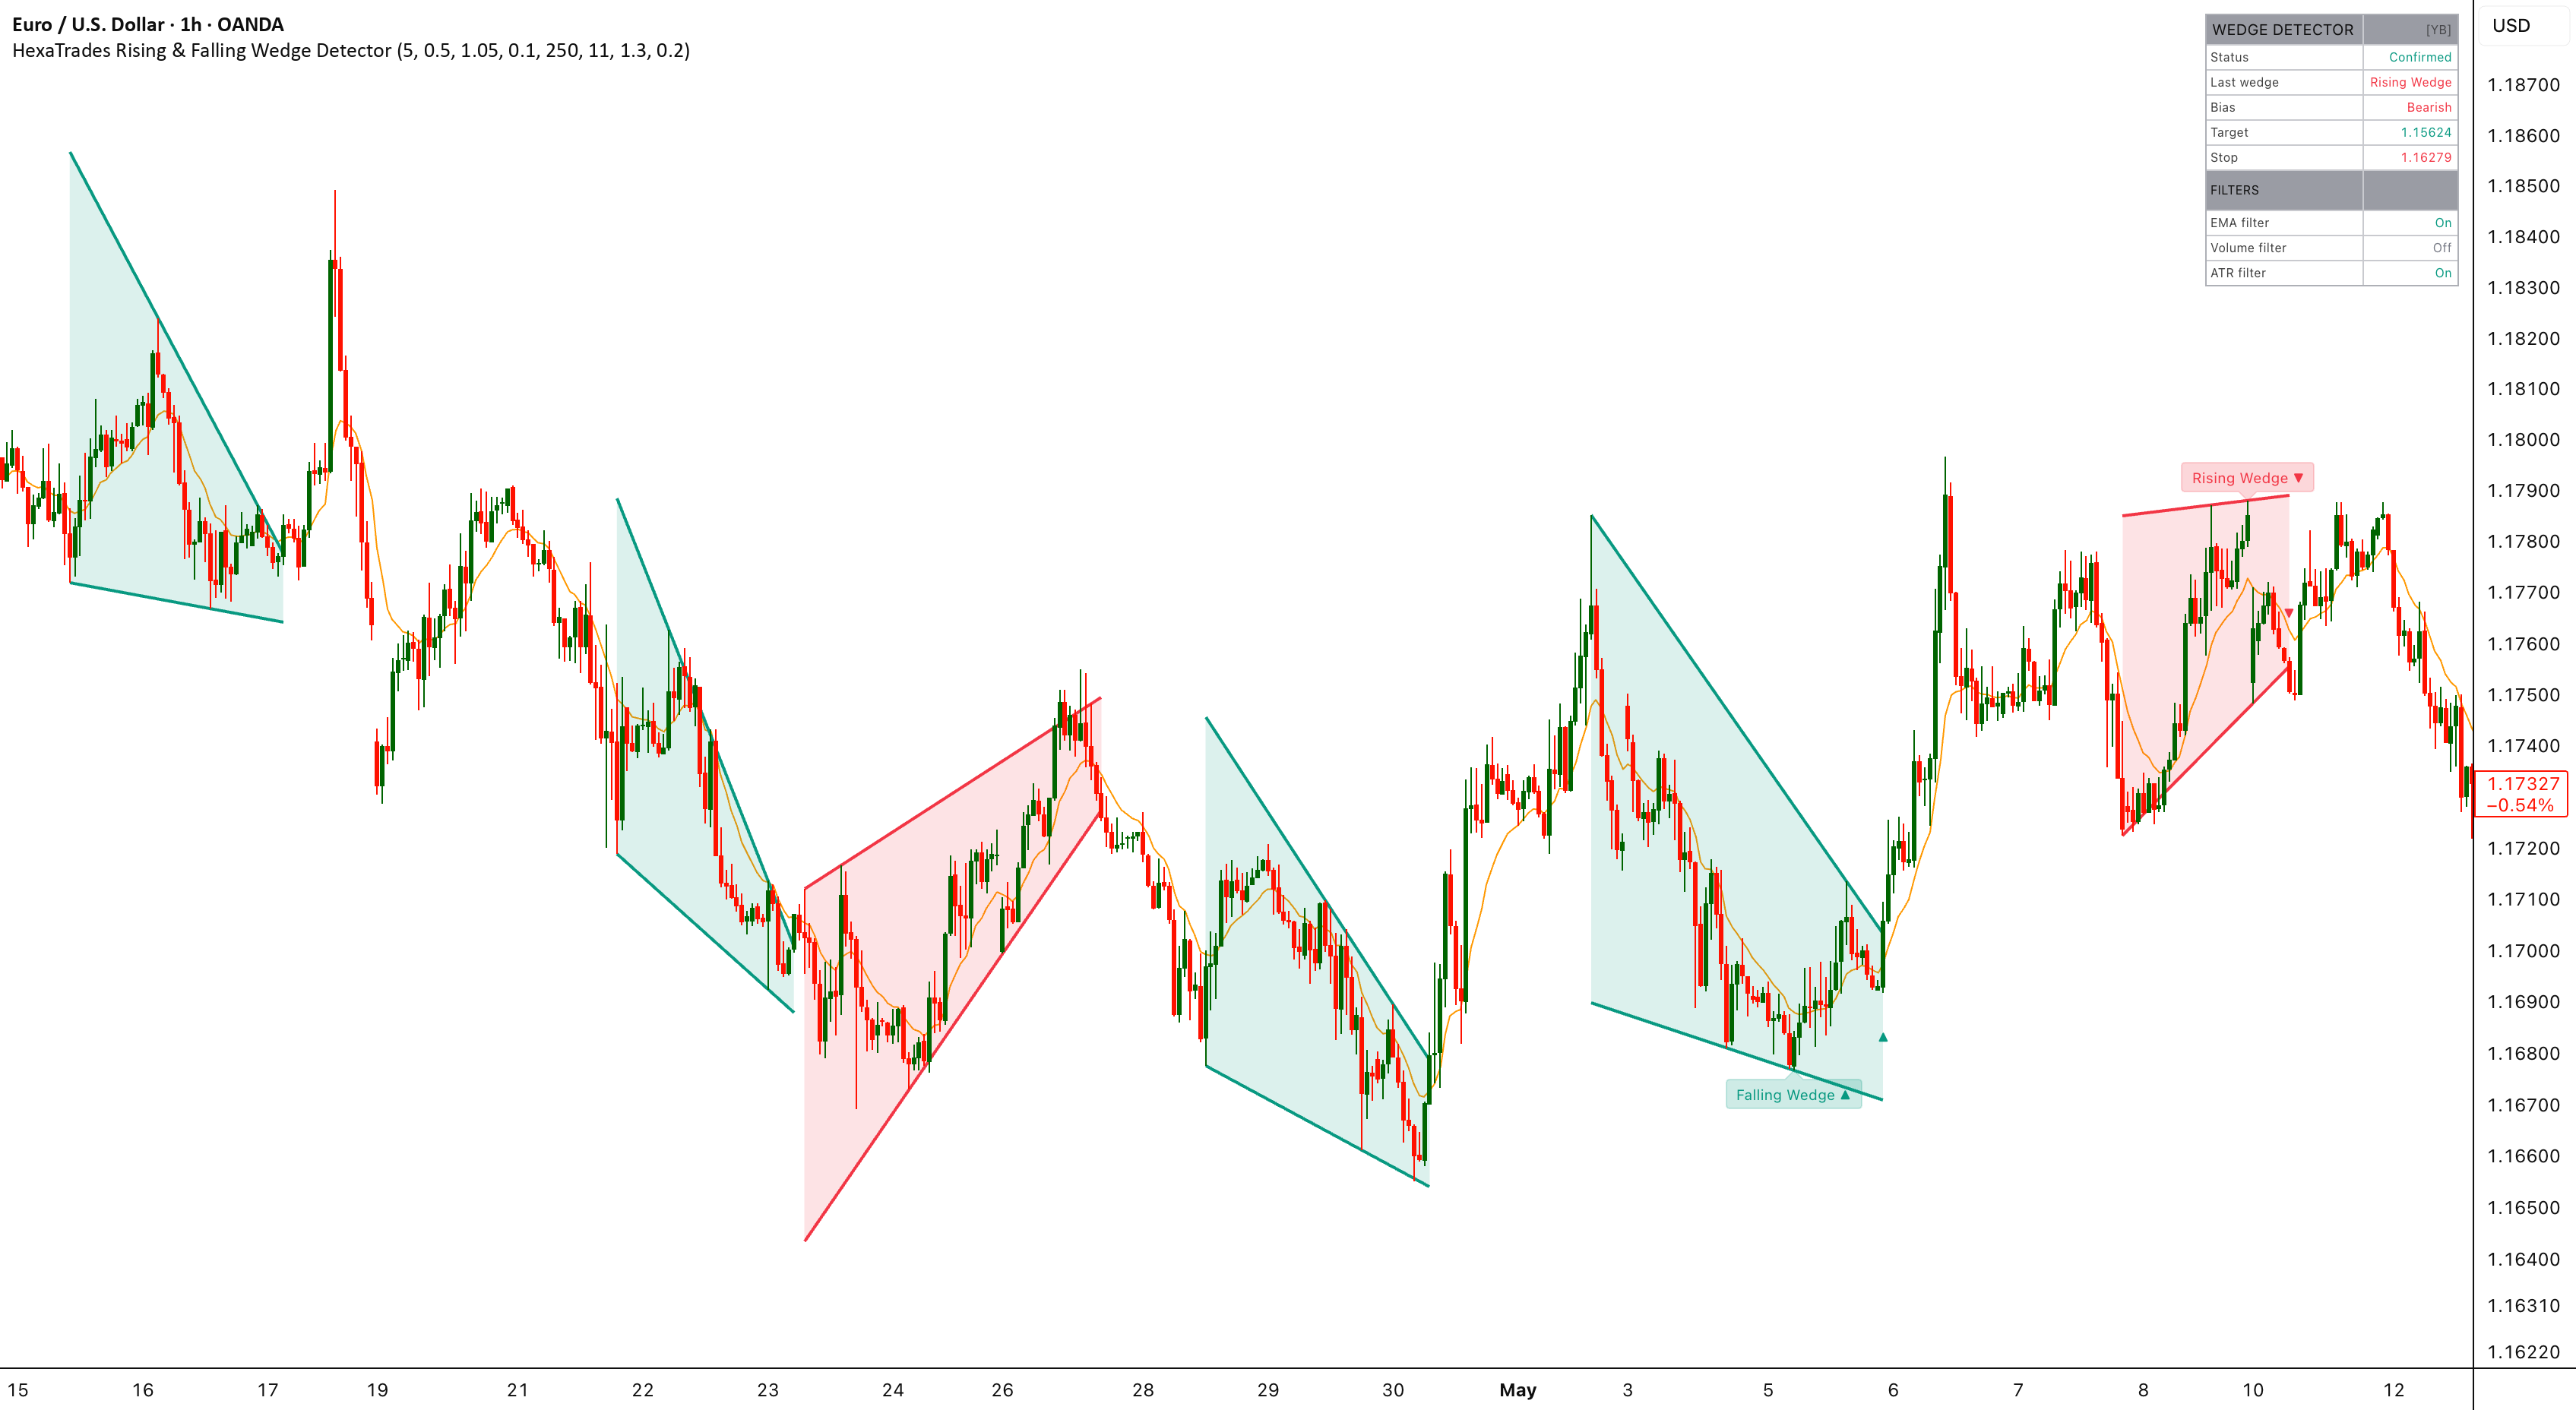
Rising & Falling Wedge Detector indicator on a TradingView chartLive on TradingView

Rising & Falling Wedge Detector[HexaTrades]

Textbook wedges only, targets included

Automatically finds and draws rising (bearish) and falling (bullish) wedges from confirmed pivots, validates the geometry through a strict perfect-shape gate, waits for a bar-close breakout, then plots a measured-move target and structure-based stop — without repainting.

  • Perfect-shape validation rejects crossing, diverging or barely-narrowing patterns
  • Dashed forming preview, then bar-close breakout confirmation — no intrabar fakes
  • Measured-move target and opposite-boundary stop drawn on the chart
  • Optional EMA trend, volume and ATR breakout filters plus three alerts
View on TradingView
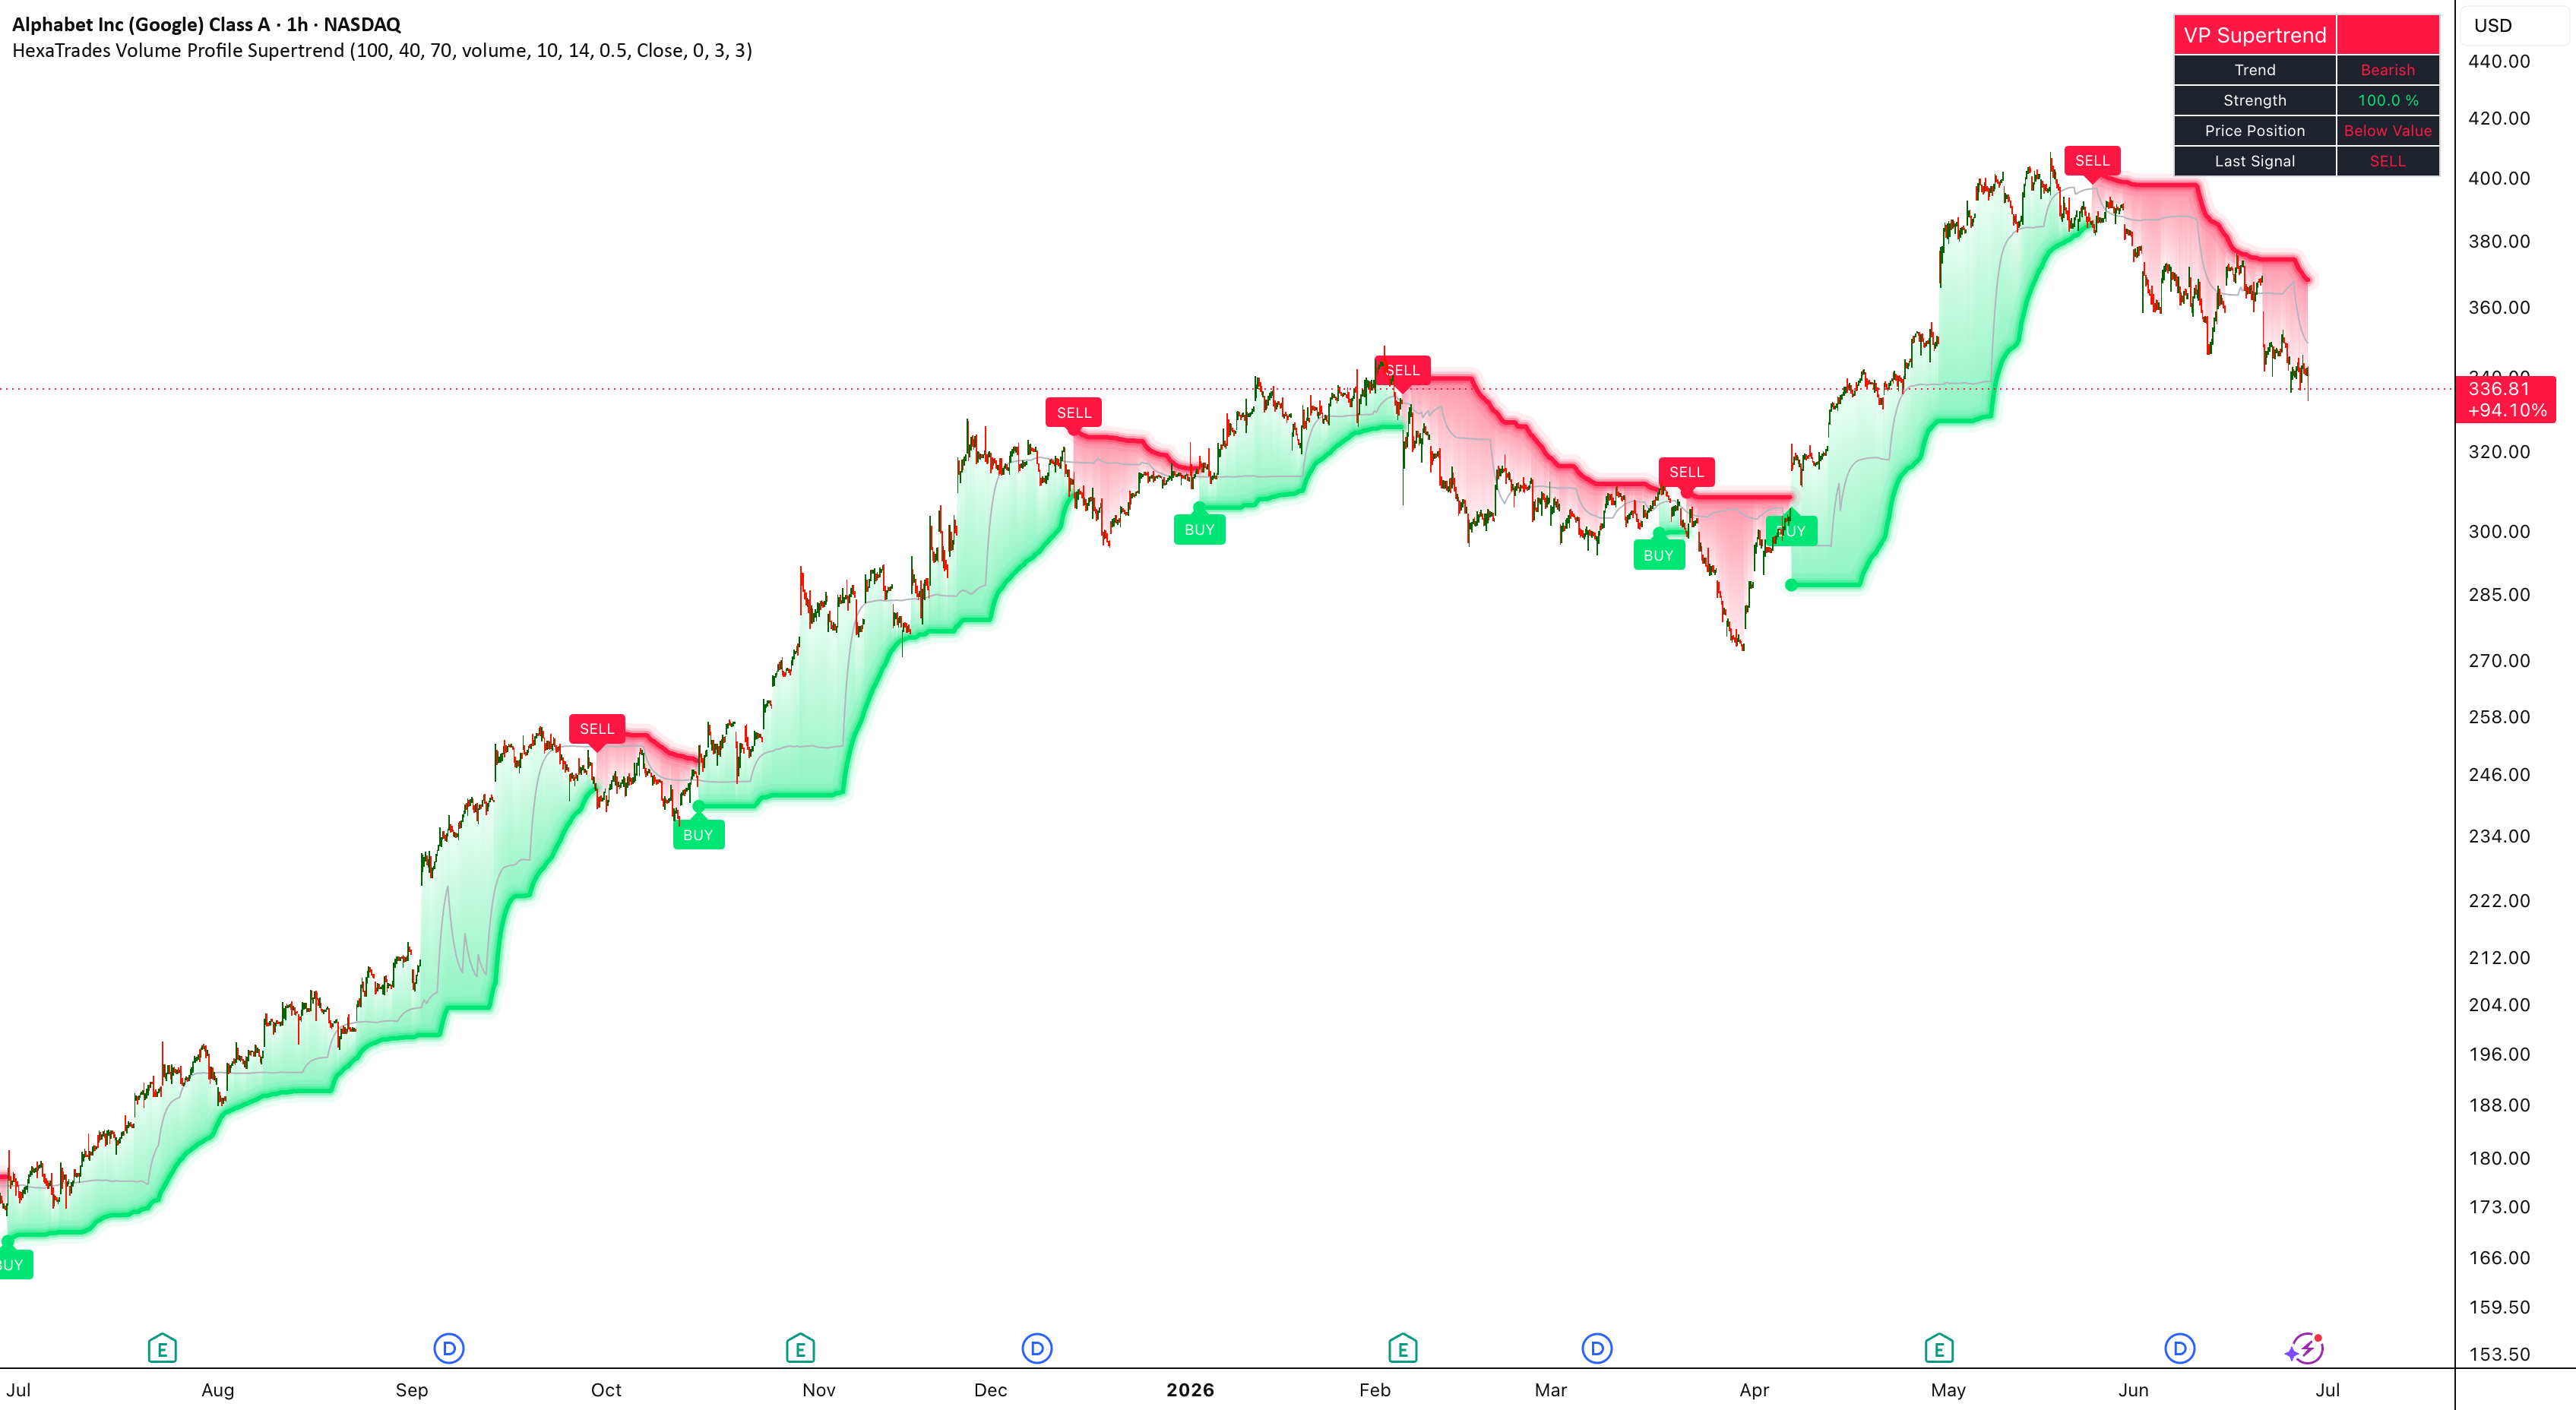
Volume Profile Supertrend indicator on a TradingView chartLive on TradingView

Volume Profile Supertrend[HexaTrades]

A Supertrend that follows value, not volatility

Re-imagines the classic Supertrend by anchoring its trailing bands to a rolling volume profile — the Point of Control and Value Area where real business gets done — so the trend engine follows value migration instead of raw ATR volatility.

  • Rolling volume profile computed fully in Pine — works on any symbol with volume
  • Bands built from smoothed VAH/VAL with an ATR buffer, trailing like a Supertrend
  • Trend flips evaluated on confirmed bars only — closed candles never change
  • Filters low-quality volatility noise that whipsaws ATR-based Supertrends
View on TradingView
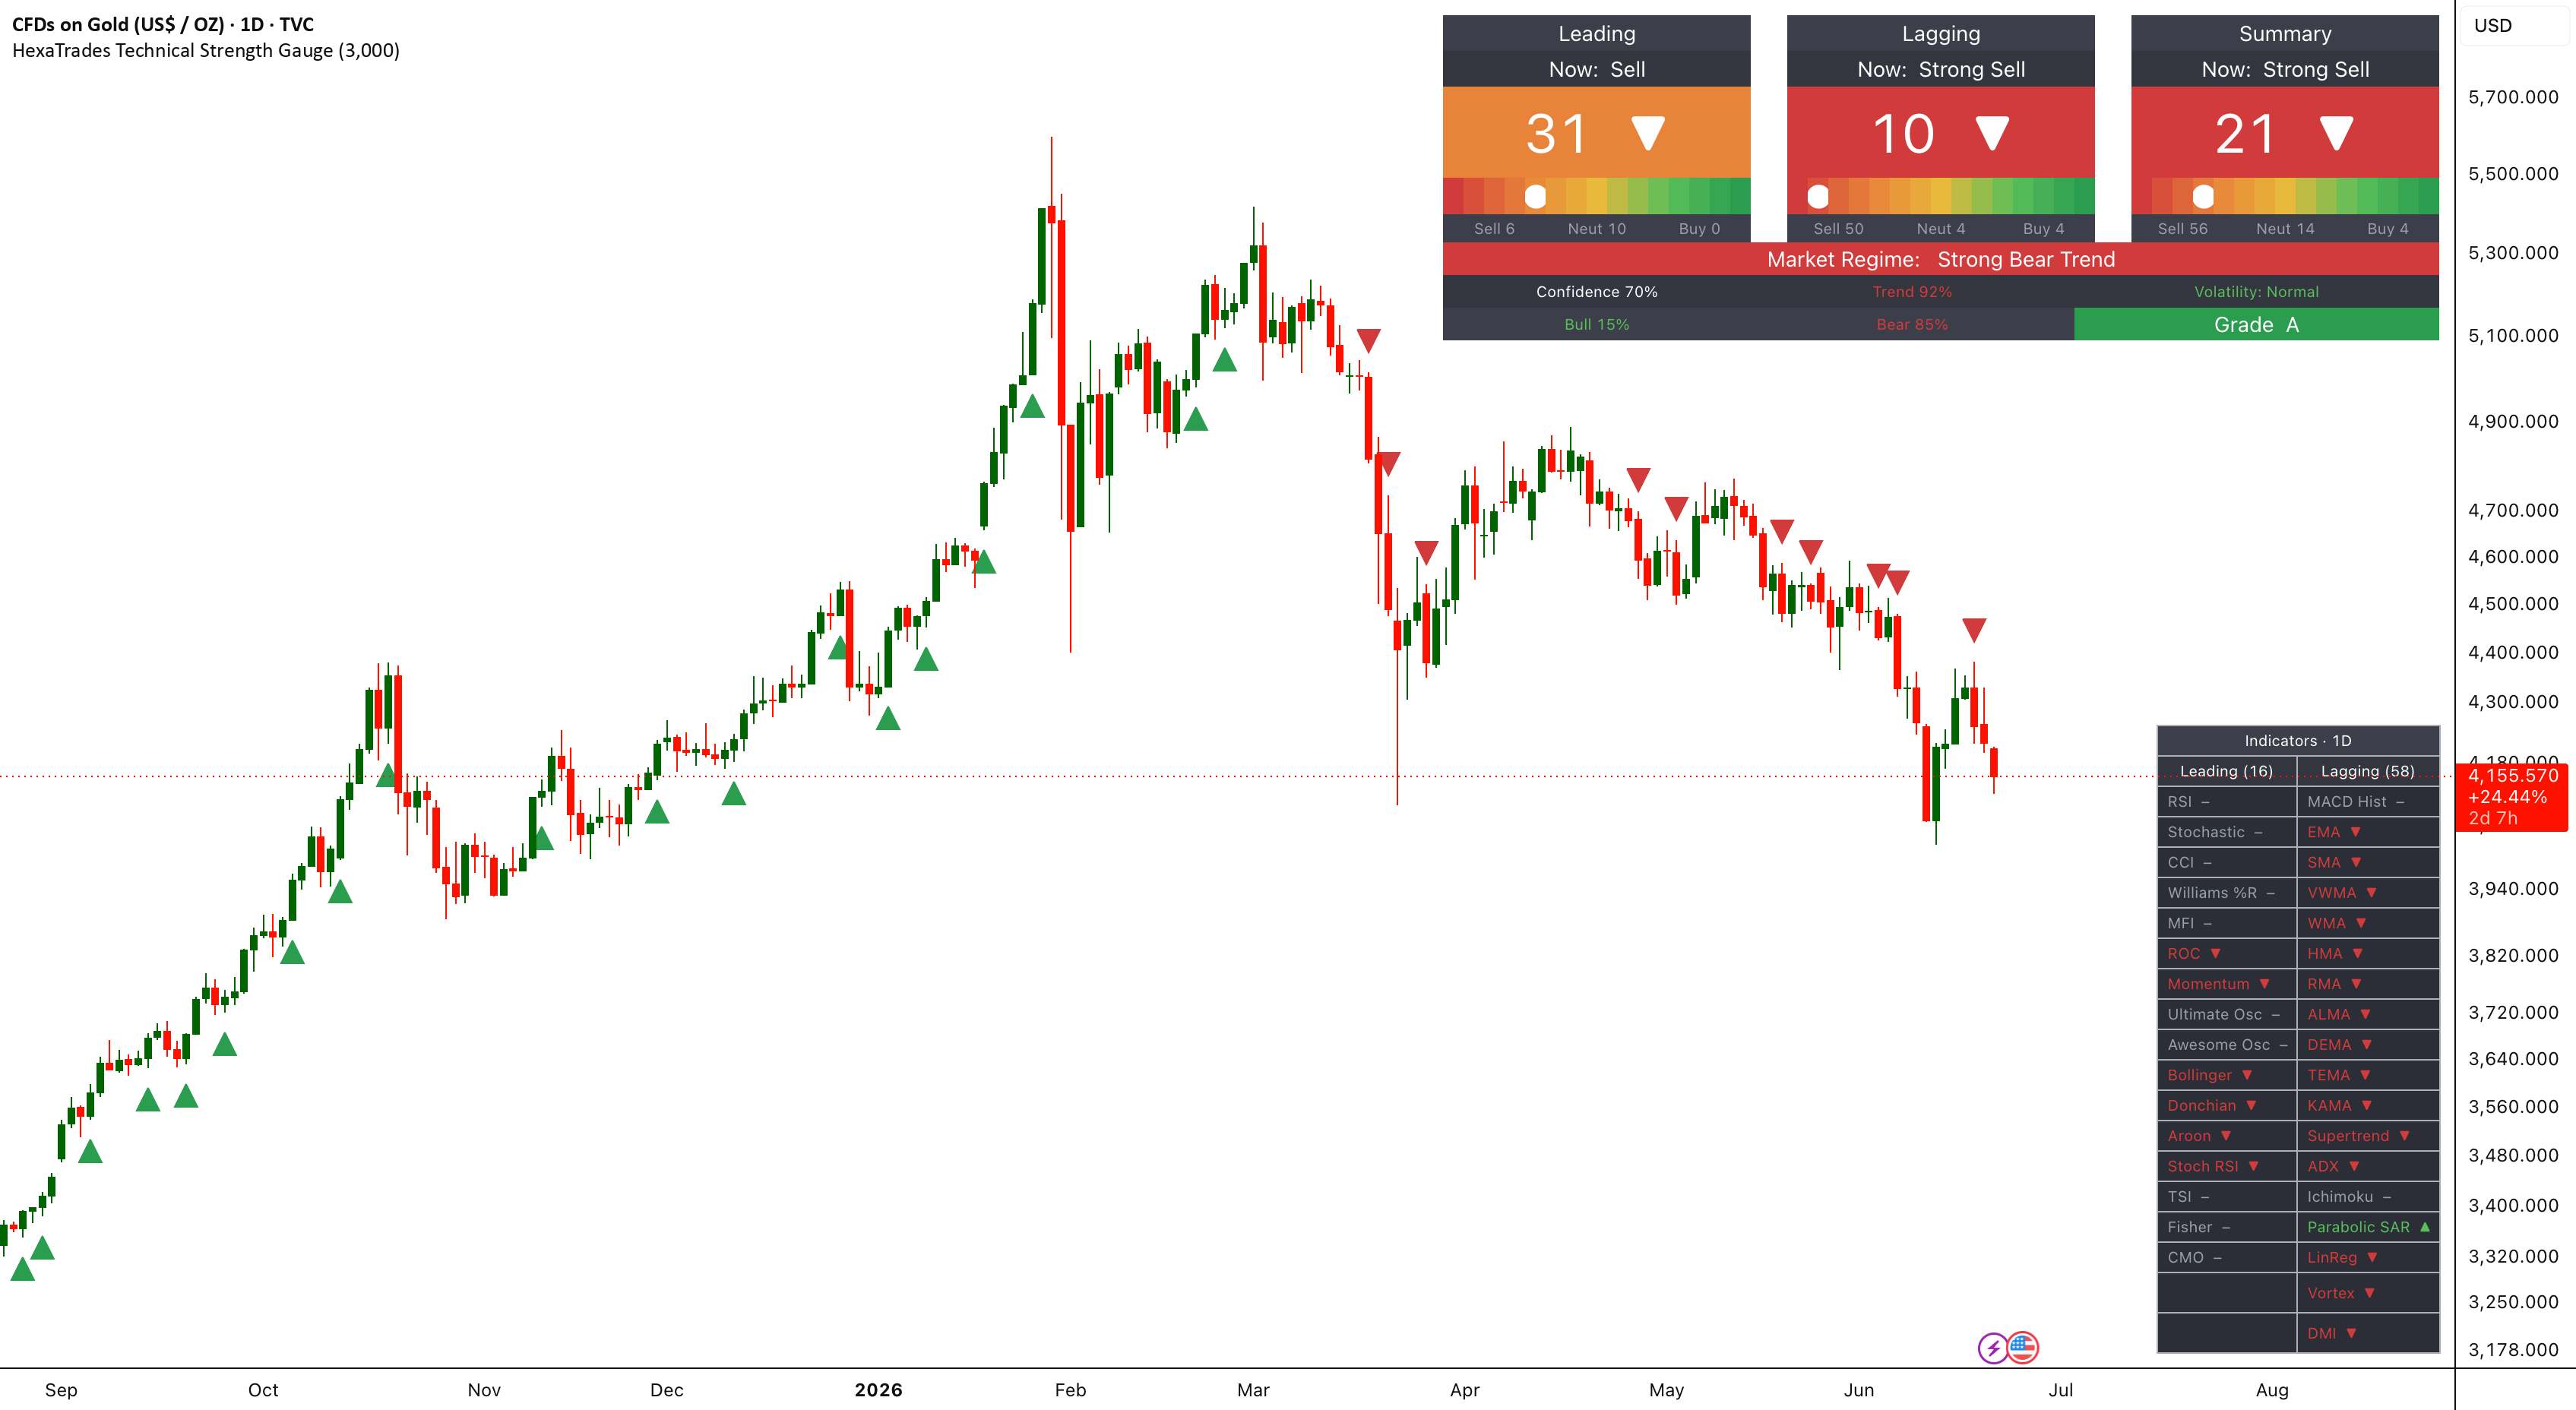
Technical Strength Gauge indicator on a TradingView chartLive on TradingView

Technical Strength Gauge[HexaTrades]

74 indicators, one objective verdict

Aggregates 74 technical indicators across 34 families into a single consensus framework, splitting them into leading (momentum) and lagging (trend-confirmation) signals to score market strength from 0–100.

  • Dual-category voting: 16 leading vs 58 lagging indicators scored separately
  • Three color-graded gauges — Leading, Lagging and Summary verdicts
  • Analytics row: market regime, trend strength, volatility, confidence and bull/bear probability
  • Customizable weights and multi-timeframe analysis
View on TradingView
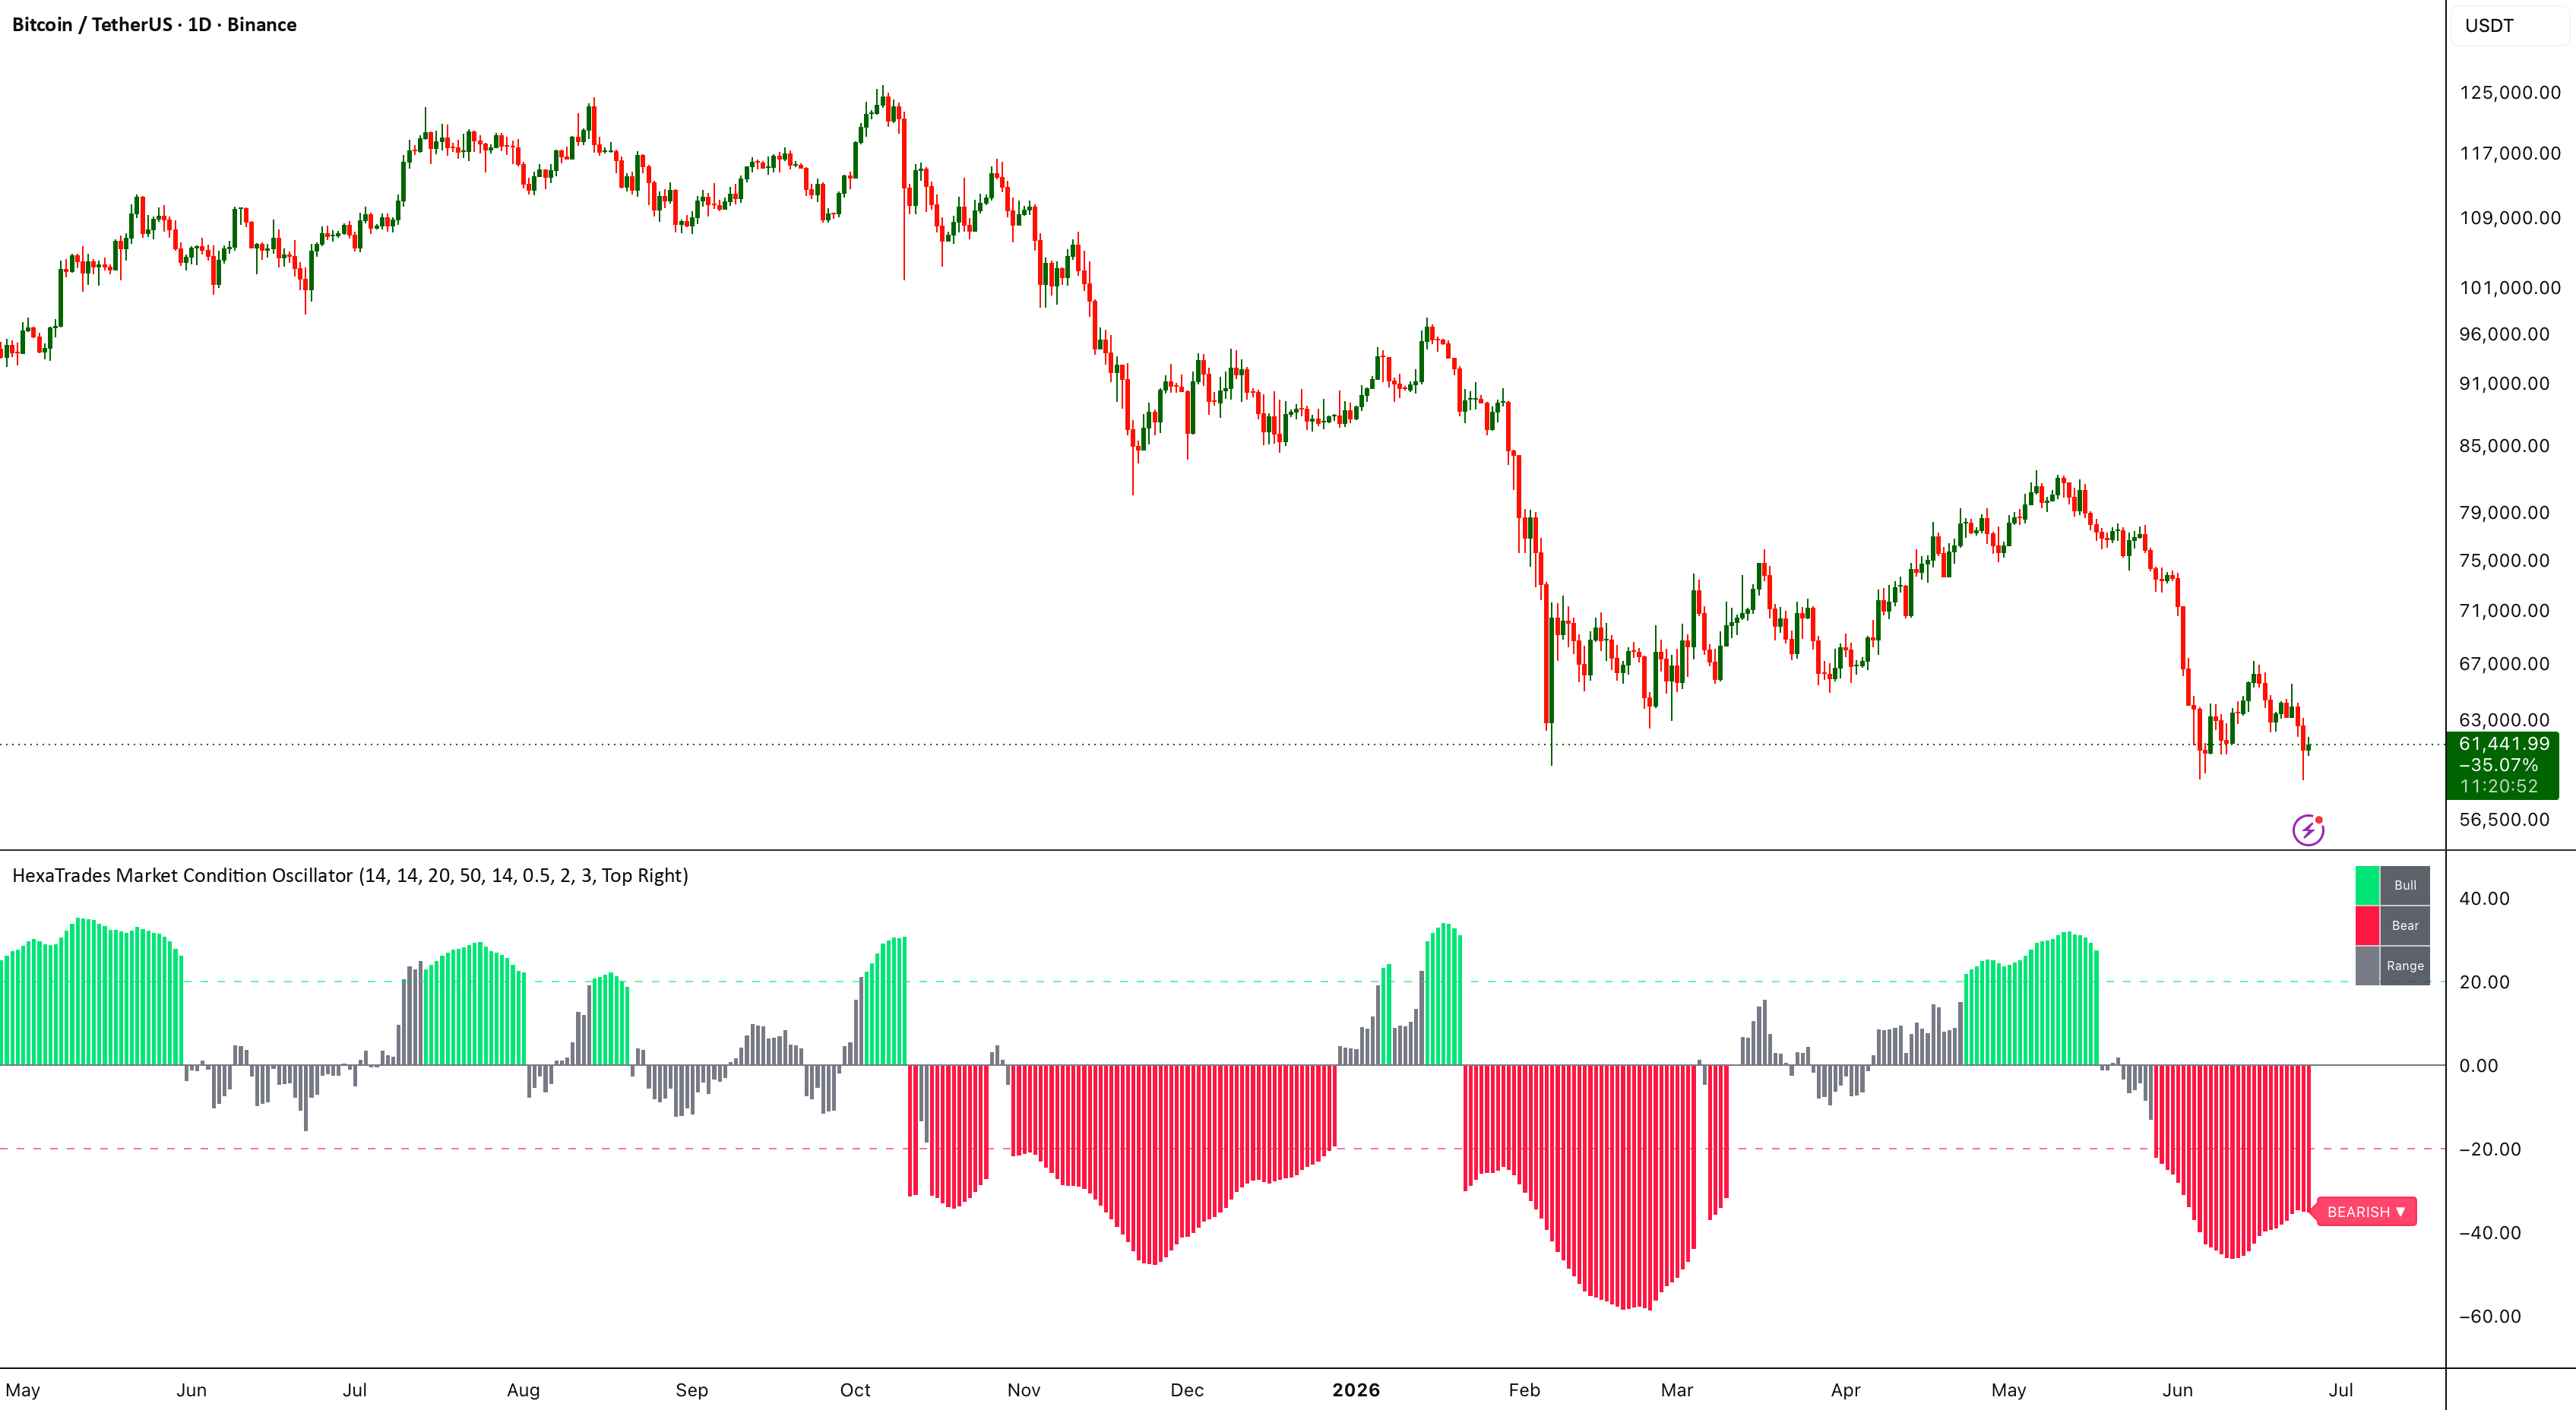
Market Condition Oscillator indicator on a TradingView chartLive on TradingView

Market Condition Oscillator[HexaTrades]

Trend or chop, answered at a glance

Classifies price action into three states — bullish trend, bearish trend or consolidation — and paints them as a color-coded histogram, combining ADX, DI+/DI−, EMA position and volatility compression so no single signal can fake a trend on its own.

  • Green/red/gray histogram with bar height showing trend strength
  • Four-factor confirmation: ADX strength, DI direction, EMA slope, ATR compression
  • Configurable confirmation bars eliminate constant phase flip-flopping
  • Alerts for bullish, bearish, consolidation and trend-flip events
View on TradingView

Trade with the full picture

Pair our indicators with real-time signals, daily analysis and a 40,000+ trader community.

Secure & private Instant access 8 years of results